공식 Documentation
https://matplotlib.org/stable/plot_types/basic/index.html
Pairwise data — Matplotlib 3.8.2 documentation
Pairwise data Plots of pairwise \((x, y)\), tabular \((var\_0, \cdots, var\_n)\), and functional \(f(x)=y\) data.
matplotlib.org
0. 목적
본 포스팅의 목적은 Matplotlib의 위 documentation에서 설명하는 가장 기본적인 시각화 툴을 보다 자세히 이해하고자 한다.
1. plot(x,y)
예제 코드
import matplotlib.pyplot as plt
import numpy as np
plt.style.use('_mpl-gallery')
# make data
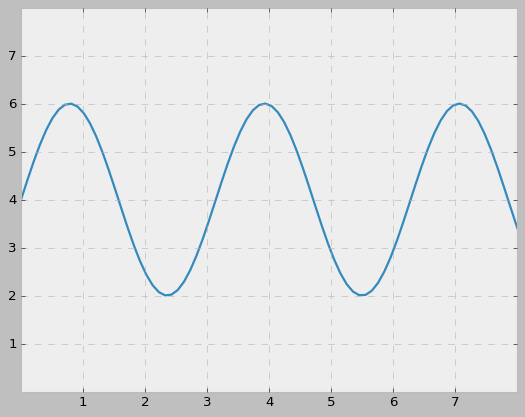
x = np.linspace(0, 10, 100)
y = 4 + 2 * np.sin(2 * x)
# plot
fig, ax = plt.subplots()
ax.plot(x, y, linewidth=2.0)
ax.set(xlim=(0, 8), xticks=np.arange(1, 8),
ylim=(0, 8), yticks=np.arange(1, 8))
plt.show()
결과

코드 해석
필요한 라이브러리들 호출
import matplotlib.pyplot as plt
import numpy as np
plot 스타일 정의
plt.style.use('_mpl-gallery')해당 스타일 외에도
plt.style.use('bmh')
plt.style.use('ggplot')
plt.style.use('classic')
plt.style.use('Solarize_Light2')
plt.style.use('default')
와 같이 다양한 스타일 사용 가능
예시


관련 공식 문서
https://matplotlib.org/stable/api/style_api.html
matplotlib.style — Matplotlib 3.8.2 documentation
matplotlib.style Styles are predefined sets of rcParams that define the visual appearance of a plot. Customizing Matplotlib with style sheets and rcParams describes the mechanism and usage of styles. The Style sheets reference gives an overview of the buil
matplotlib.org
데이터 생성
x = np.linspace(0, 10, 100)
y = 4 + 2 * np.sin(2 * x)
np.linspace에 들어가는 세 param은 각각 구간 시작점, 구간 끝점, 구간 내 숫자 개수 을 의미
예시
import numpy as np

x = np.linspace(1,10,100)

x
출력 결과

1부터 10까지, 처음을 1 마지막을 10으로 하는 100개 element를 가지는 1차원의 array를 만듦.
y는 해당 x에 대응되는 각각의 함수 값을 갖게 됨.
x는 numpy.ndarray의 타입을 갖게 되므로 위와 같은 연산이 가능
(list의 경우 해당 연산이 불가하는 것으로 아는데 y식 정의에 np가 들어가있어 가능한 듯)
fig, ax = plt.subplots()
관련 문서
Clearing the confusion once and for all: fig, ax = plt.subplots()
Learn about figure and axes objects in Matplotlib
towardsdatascience.com
이 부분은 많은 예시 코드들에서 공통적으로 사용하고 있는 부분인데 어떤 의미일까.
(Note : subplot과 subplots는 다름)
#기본
plt.subplots(nrows, ncols)
예시 1
fig, ax = plt.subplots()
plt.show()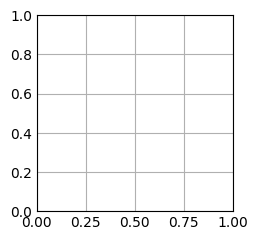
예시 2
fig, ax = plt.subplots(2,1)
plt.show()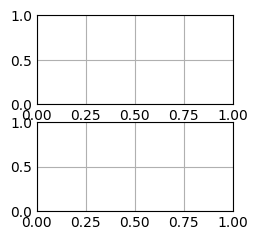
nrows와 ncols에 m, n이라는 정수형 인자를 각가 넣으면 m by n matrix 느낌의 plot들이 구성된다.
예시 3
sub_plots = plt.subplots(3,2)
print(sub_plots)
print("TYPE IS : ", type(sub_plots))
이 부분에서 살짝 의외였다. sub_plots 객체의 type이 tuple이라니.
아마 fig, ax로 쪼개는 것을 통해 length가 2짜리인 (fig, ax)의 형태로 이루어진 tuple이 아니었을까
예시 4
fig, ax = plt.subplots(3,2)
print(fig)
print(ax)
print("TYPE IS : ", type(fig))
print("TYPE IS : ", type(ax))
예시 5
sub_plots = plt.subplots(3,2)
print(sub_plots[0])
print("##########")
print(sub_plots[1])
print("##########")
print(sub_plots[1][0])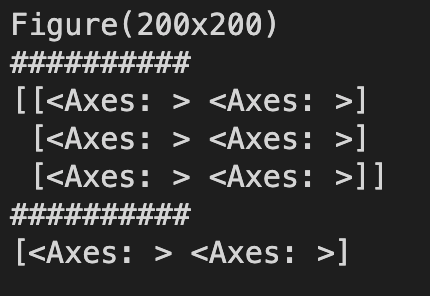
확인을 해보니 fig, ax의 길이가 2짜리인 튜플이 맞는 것 같다.
ax 파트에는 3 by 2 형태의 2차원 array들이 들어있어 각각에 대한 정의를 해줄 수 있다.
'Data > Visualization' 카테고리의 다른 글
| [Matplotlib] 3D Plot (0) | 2023.12.08 |
|---|